If you follow the financial markets, you have most likely seen the “I” word recently – inflation. Although benign since 2008, inflation is on the “risk radar” of many asset managers heading into 2018. Some asset managers believe that higher inflation may cause the FED to raise rates faster than expected, which should cause bond yields to rise, which should cause stocks to fall. Whew! That was a mouthful!
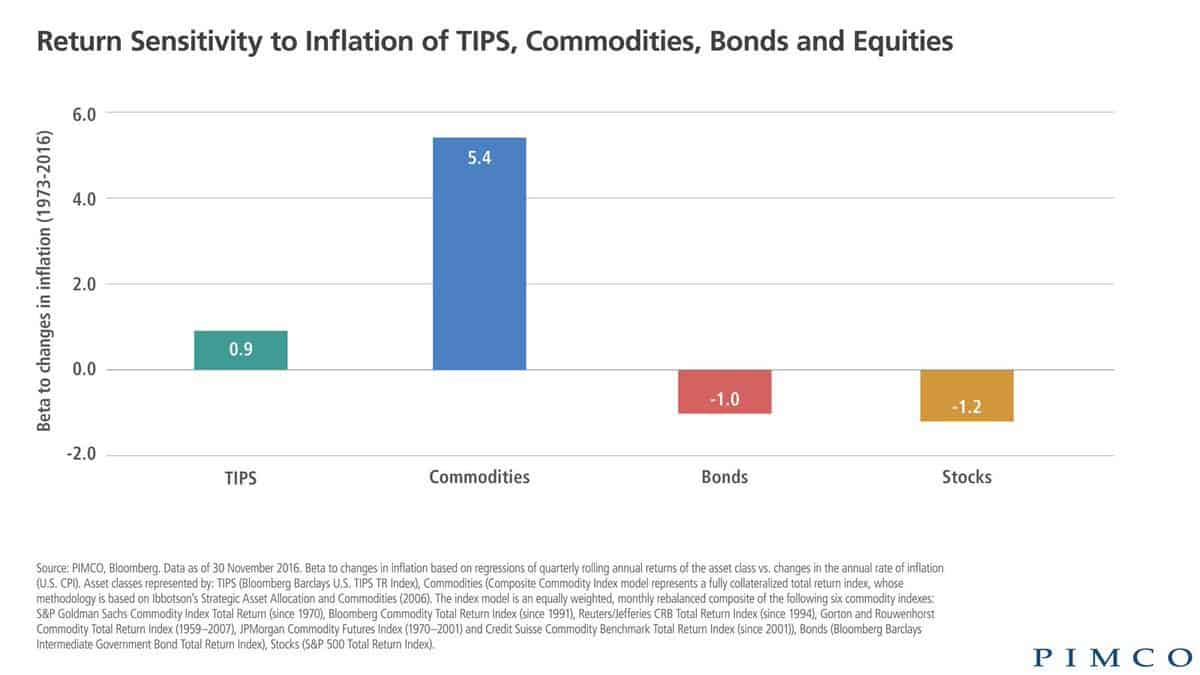
Maybe inflation comes back and maybe it doesn’t, but you can’t end the inflation conversation without mentioning commodities. Versus other asset classes, commodities tend to perform well in times of increasing inflation. This graph from PIMCO helps tell the story*.
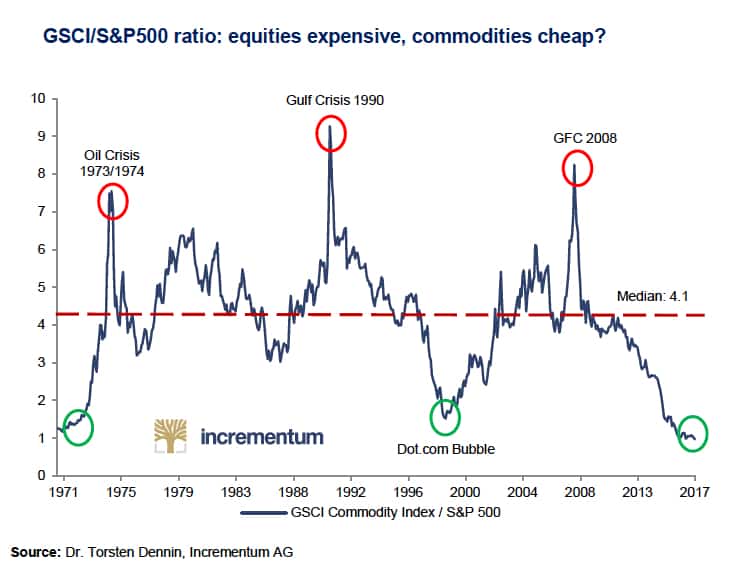
Commodities are not for the timid. This is a volatile asset class that is notoriously hard to invest in due to a number of factors. Over the last five years, commodities investors have had a tough time: the Morningstar Long-Only Commodity Index has had a return of negative 9.07%** annualized during that time. The S&P 500 has returned over 14%** annualized over the same time frame. This stark difference in returns has made commodities very cheap compared to US stocks. In fact, going back to 1971 commodities have NEVER been this cheap when compared to the S&P 500. See the chart from Incrementum below***.
Is now the time for commodities? Only time will tell.
Charles Brown is a Portfolio Manager and Financial Advisor at M. Brown and Associates in Naperville, Illinois
* “TIPS” stands for Treasury Inflation Protected Securities – these are bonds whose “par value” rises or falls based on an inflation index. “Beta” is a measure of volatility in an asset class when compared to another asset class. This charts illustrates the historical returns of various asset classes after a 1% rise in inflation.
** Returns are as of 3/1/18 from morningstar.com
*** “GSCI” stands for the Goldman Sachs Commodities Index. This chart shows you the potential return if you bought the GSCI index and sold the S&P 500. When the line is rising, the S&P 500 is outperforming commodities by the factor (in 100’s of percent) listed on the y-axis. When the line is falling, the opposite is true.
****The above article is informational in nature only and is not a recommendation to buy or sell securities. All information is gathered from sources believed to be reliable, but neither Charles Brown nor Ausdal Financial Partners, Inc guarantees the accuracy of the information. All investments carry a degree of risk. Individuals should consult with their tax and investment professionals before making changes to their investment portfolios.
*****Securities and Investment Advisory services offered through Ausdal Financial Partners, Inc, 5187 Utica Ridge Road, Davenport, IA 52807 (563)326-2064. Member: FINRA/SIPC. M.Brown and Associates and Ausdal Financial Partners are independently owned and operated