As we enter 2019 and the 10th year of the economic expansion here in the United States, many end-of-year research reports will address the big question: is the US economy headed into a recession* sometime in 2019? There are dozens of indicators that have a history of correctly predicting recessions. Those same indicators also have a history of “false positives” or incorrectly predicting recessions. Today, just for fun, I will show you a handful of the many I follow**.
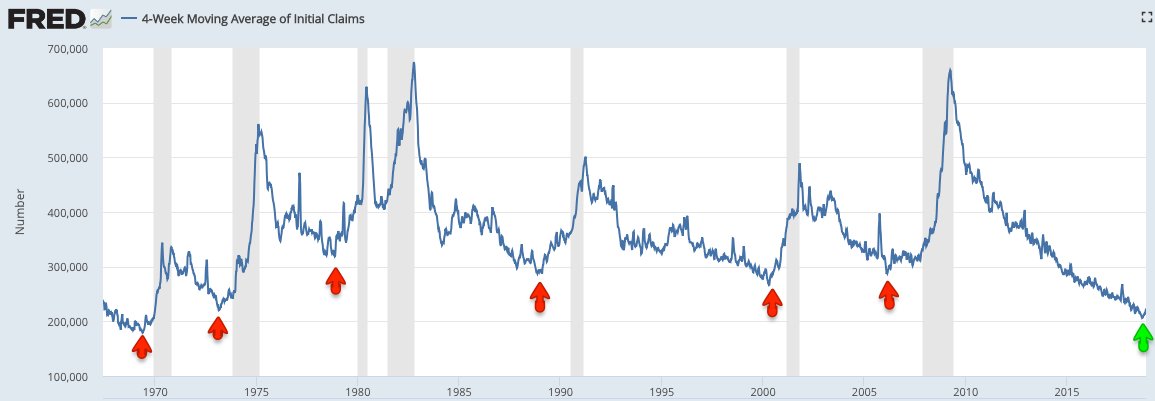
Here is the 4 week moving average of jobless claims – the shaded areas are recessionary periods. You can see here that jobless claims start to increase, somewhat reliably, many months before a recession occurs. The green arrow is where we stand today. Is the recent uptick in jobless claims just a “blip”, or part of a bigger trend just getting started?
The second indicator is credit spreads. This graph shows the yield that junk bond investors receive over the yield provided by US Treasury bonds. Again, shaded areas are recessionary periods. You can see that when the economy is doing fine, junk bonds investors are willing to accept relatively low yields in exchange for owning these high risk bonds. Once investors in this space sense a recession coming they become less willing to own junk bonds with lower yields. Lack of demand causes the spread to rise. Is the recent (green arrow) uptick in credit spreads the start of a huge increase in credit spreads leading to a recession? Or is it a “false positive” similar to 2011 and 2016?

The previous two indicators are not really screaming “recession”, but if there is one indicator that is, it is this one. As you can see housing starts tend to peak a long time (years!) before a recession (shaded area) occurs with a fairly reliable track record. The most recent green arrow shows us that it looks like housing starts peaked this cycle in 2017. Housing starts have been moving lower ever since. This chart is telling us that IF housing starts continue to fall, a recession may be on the horizon. But again, this is a leading indicator with a history of long lead times. Are we 1 year away from a recession? Or 4 years away?
You cant have a recession indicator conversation without mention the 2’s 10’s yield spread. This indicator simply shows the yield in percentage terms when you take the yield on 10 year US treasuries and subtract the yield on 2 year US treasuries. When the difference between these two bonds drops to zero (black line) or below, that is your recession warning. We will not go into the “why” on this indicator because it will take up too much time – drop me an email and I will gladly explain further. Needless to say, this has been a good indicator. What is this chart saying now? It looks like we are headed towards the black line (zero) but we have not touched it yet. Thus, no recession warning.

So is there a recession coming in 2019? Well we have one indicator that says “yes”, one that says “no”, and two more that say “maybe”, but its too soon to tell. If we ask the Magic Eight Ball I think it would say “Reply Hazy, Try Again Later”. It really is too soon to tell if a recession is around the corner. 2019 will provide many more data points that will help answer this big question. I will be monitoring these data points closely.
* The definition of a recession, according to the Bureau of Labor statistics is two consecutive quarters of contracting economic growth – usually defined by Gross Domestic Product.
** All charts are from the Federal Reserve Economic Data (FRED) provided by the St.Louis Federal Reserve. All charts are from November 2018. Shaded areas are recessionary periods. Time frames vary.
**The above article is informational in nature only and is not a recommendation to buy or sell securities. All information is gathered from sources believed to be reliable, but neither Charles Brown nor Ausdal Financial Partners, Inc guarantees the accuracy of the information. All investments carry a degree of risk. Individuals should consult with their tax and investment professionals before making changes to their investment portfolios.
***Securities and Investment Advisory services offered through Ausdal Financial Partners, Inc, 5187 Utica Ridge Road, Davenport, IA 52807 (563)326-2064. Member: FINRA/SIPC. M.Brown and Associates / M. Brown Financial Advisors and Ausdal Financial Partners are independently owned and operated