-By Charles Brown, M.Brown Financial Advisors
-October 25, 2022
It continues to be a very bad year for most asset classes this year. Here are a few charts that gives us a good idea of where we stand today. They may also give us a glimpse of what is to come.
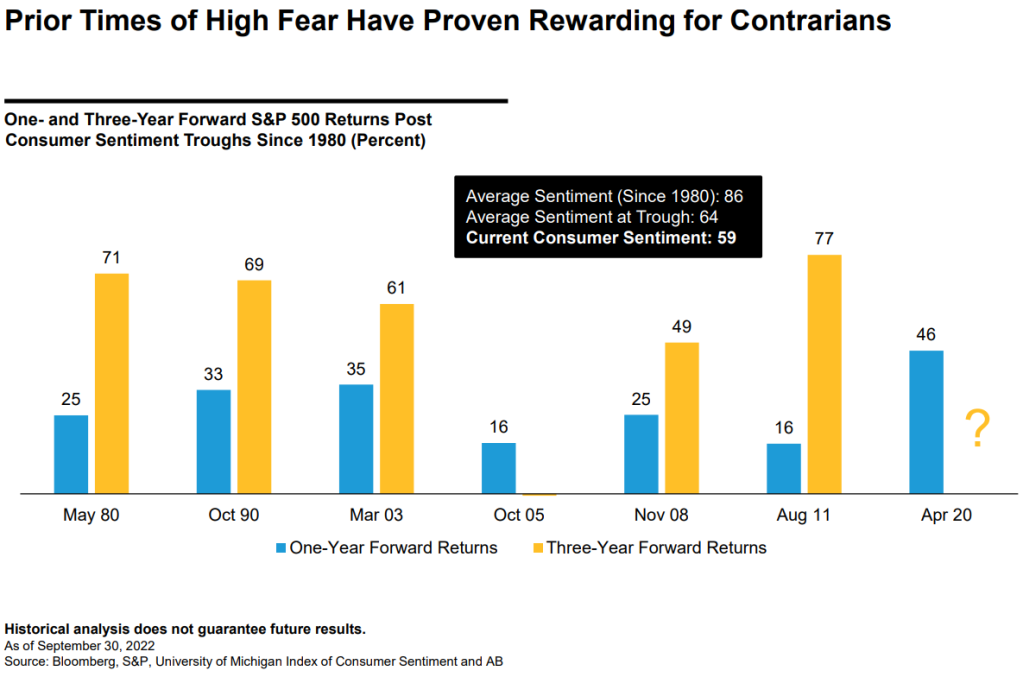
This graph is based on the University of Michigan Consumer Sentiment survey. The black box tells us that consumers are very pessimistic right now – current consumer sentiment has a reading of 59 which is well below the average reading (86) and even below the level where the survey has bottomed historically (64). The graph shows us that future returns in the S&P 500** have been significant in prior instances of the survey hitting a bottom and rising again. This survey is released monthly and the “trough” in this survey is something to watch for.
This chart shows the valuation of the S&P 500 over time. The table to the right shows that valuations have come down quite a bit from their highs at the end of last year, meaning stocks have gotten cheaper. Valuations look to be back to historical averages for the index. The table also shows us that valuations are now well below their 10-year averages, and we can see that the valuations we have today encouraged buyers to go bargain shopping in years such as 2014, 2018 and 2020. Will buyers step in again? We shall see.

The last chart refers to “small caps” which are the stocks of smaller companies with market capitalizations between $300 million to $2 billion. The chart shows us the percentage of small cap stocks as a part of the entire US stock market universe. Small cap stocks average about a 7% weighting in the entire US market. They now have a 4% weighting – near the lowest ever for the ratio. This tells you that small cap stocks have sold off much more than large caps recently, resulting in a smaller weighting compared to all US stocks. The table on the right shows us prior instances when small cap stocks have sold off particularly hard during the first three quarters of the year. In prior instances, the average returns one and three years out were significant (although the one-year returns include some years where returns got much worse before they got better). Something to watch.

Past performance does not guarantee future results. As of 9/30/22. Source: Center for Research in Security Prices, FTSE Russell, AB
**The S&P 500 is an index. You cannot invest directly in an index.
***The 200-day Simple Moving Average is calculated by taking the closing price of the index (or any security) on every day over the last 200 trading days, adding those prices together, and then dividing by 200.
****The above article is informational in nature only and is not a recommendation to buy or sell securities. All information is gathered from sources believed to be reliable, but neither Charles Brown nor Ausdal Financial Partners, Inc guarantees the accuracy of the information. All investments carry a degree of risk. Individuals should consult with their tax and investment professionals before making changes to their investment portfolios.
*****Securities and Advisory Services offered through Ausdal Financial Partners, Inc., an SEC registered investment adviser, member FINRA & SIPC. 5187 Utica Ridge Rd., Davenport IA 52807, 563-326-2064, www.ausdal.com. Sub-advisory services offered through M. Brown Financial Advisors, a registered investment adviser with the state of Illinois. M. Brown Financial Advisors is located at 2728 Forgue Drive, Suite 100, Naperville, IL 60564, 630-637-8600. M. Brown Financial Advisors and Ausdal Financial Partners are unaffiliated entities and only transact business in states where they are properly registered, or are excluded or exempt from registration requirements. Registration of an investment adviser does not imply any specific level of skill or training and does not constitute an endorsement of the firm by the Commission or any state regulators. Ausdal Financial Partners, Inc. does not accept buy, sell or cancel orders by email, or any instructions by e‐mail that would require your signature. Information contained in this communication is not considered an official record of your account and does not supersede normal trade confirmations or statements. Any information provided has been prepared from sources believed to be reliable but does not represent all available data necessary for making investment decisions and is for informational purposes only.