As investors living in the United States, most investing “media” covers the US equities markets. When someone tells you “the market was up again today”, you may immediately think about the Dow Jones or S&P 500 indexes. However, US stocks only make up about 52% of the global equity markets weighted by market capitalization – the other 48% is in International (about 38%) and Emerging Markets (about 10%)*.
Most US investors tend to invest in US based stocks and indexes – a documented phenomenon called “home country bias”. The thinking goes, “why buy Vodafone when I can buy Verizon, and why buy Novartis when I can buy Pfizer?” US investors have been rewarded for this bias over the past ten years – the S&P 500 has outperformed the MSCI EAFE index seven out of the last ten calendar years**. But will it continue?
As an ex-trader I like to look at fund flows to see where institutions, traders and investors are putting their money. Take a look at the chart below which I find very interesting:
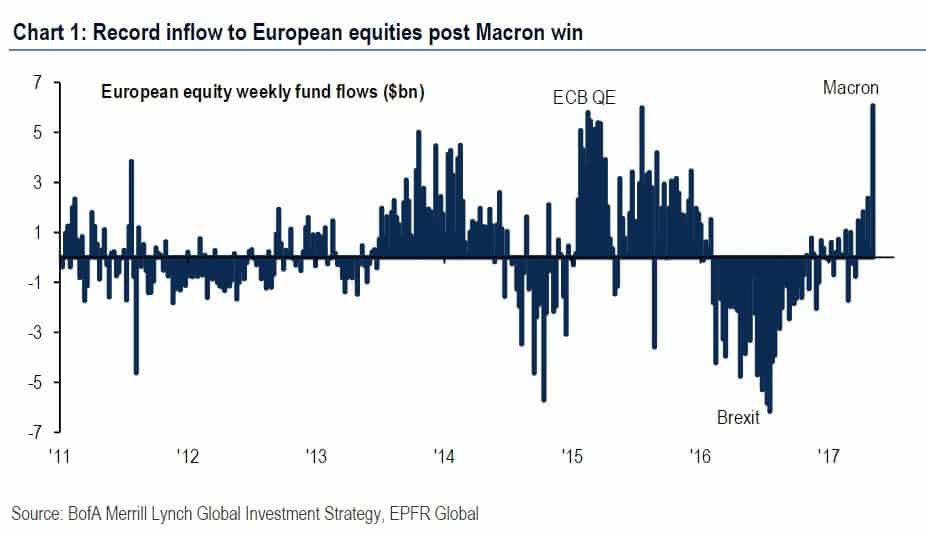
European equities are not a perfect proxy for all International Developed markets, but they do make up a very big chunk of that particular asset class (Japanese equities are also a large portion of the International EAFE index****). This chart shows us that since early 2016, large amounts of money had been flowing out of European stocks. However, flows back into European equities started in 2017 and significantly increased when Macron won the French presidential election.
Fund flow trends can persist for months or even years, and those flows can create good returns in that particular asset class. Investors often “chase” good returns, and this can lead to even greater fund flows into the asset class. This is how powerful investing trends are made. With many calling US markets “overvalued”, it seems some investors are moving into International markets. Returns this year seem to support this theory: International equities are up 12.3%*** YTD while the S&P 500 is up 7.5%*** YTD. Time will tell if this trend will last.
*data is from the MSCI ACWI index – fact sheet here
**return statistics are from www.morningstar.com – 2007 to 2016
***return statistics from www.morningstar.com as of 5/12/17
****data is from the MSCI EAFE index – fact sheet here
*****Key to the above chart: “ECB QE” refers to the quantitative easing undertaken by the European Central Bank in early 2015. “Brexit” refers to Great Britain voting to leave the Eurozone. “Macron” refers to the victory of Emmanuel Macron in the recent French election.
The above article is informational in nature only and is not a recommendation to buy or sell securities. All information is gathered from sources believed to be reliable, but neither Charles Brown nor Ausdal Financial Partners, Inc guarantees the accuracy of the information. All investments carry a degree of risk. Individuals should consult with their tax and investment professionals before making changes to their investment portfolios.